ABOUT ME

Hello, I'm Michał, as you might have already noticed :).
My journey into data analysis began during my studies, where I discovered the power of data-driven insights. With a natural inclination towards analytical thinking, I approach challenges with curiosity and a desire to understand the underlying patterns. My academic background has not only honed my technical abilities but also fostered my capacity to connect these insights with real-world applications. This balance between analysis and understanding the human element is what drives my work.

My aim is to continually improve and make a meaningful impact on the world. Feel free to explore my portfolio—I'm confident that together, we can create something great!


CAREER

  • Jul 2022 – Dec 2024

    Novartis External Contractor
    Warsaw

    Data Analyst

    Collaborative member of an international team specializing in: reporting, developing analytical tools, co-designing KPIs, process optimization and delivering actionable insights for informed decision-making.

  • Aug 2020 - Jan 2022

    Warehouse Employee – Logistics
    Bielany Wrocławskie

    Employee at a logistics center

    Logistics Center Employee specializing in: warehousing operations, process consolidation, and managing customer returns

EDUCATION & COURSES

  • Oct 2020 - Jan 2024

    Wroclav University of Science and Technology

    Management Engineering
    IT Appliance in Business

    Thesis: Development of a tool for interactive data visualization in R Shiny for monitoring the product labeling process at Medic company.

  • Feb 2022 - Jun 2022

    DataCamp

    Certified courses

    Areas: R language, data analytics, shiny framework, machine learning

  • Sep 2017 - Jun 2020

    Carolinum High School

    Mathematics-Computer Science-Physics Profile

InfoFlare

InfoFlare is a data-driven project dedicated to providing insights and visualizations centered on various topics. The project emphasizes transparency and clarity, making complex data accessible and understandable for a wide audience.

Time40

Time40 is an application that uses scraping to obtain data and then analyze it in a simple drill-through form. Are you thirsty? This app will help you to find the best tea (or coffee) to buy at fiveoclock.eu ;)

Lucent

The result of engineering work, the essence of which is the design of an analytical application allowing for the acquisition, transformation and presentation of data for supply chain employees.

RPubs

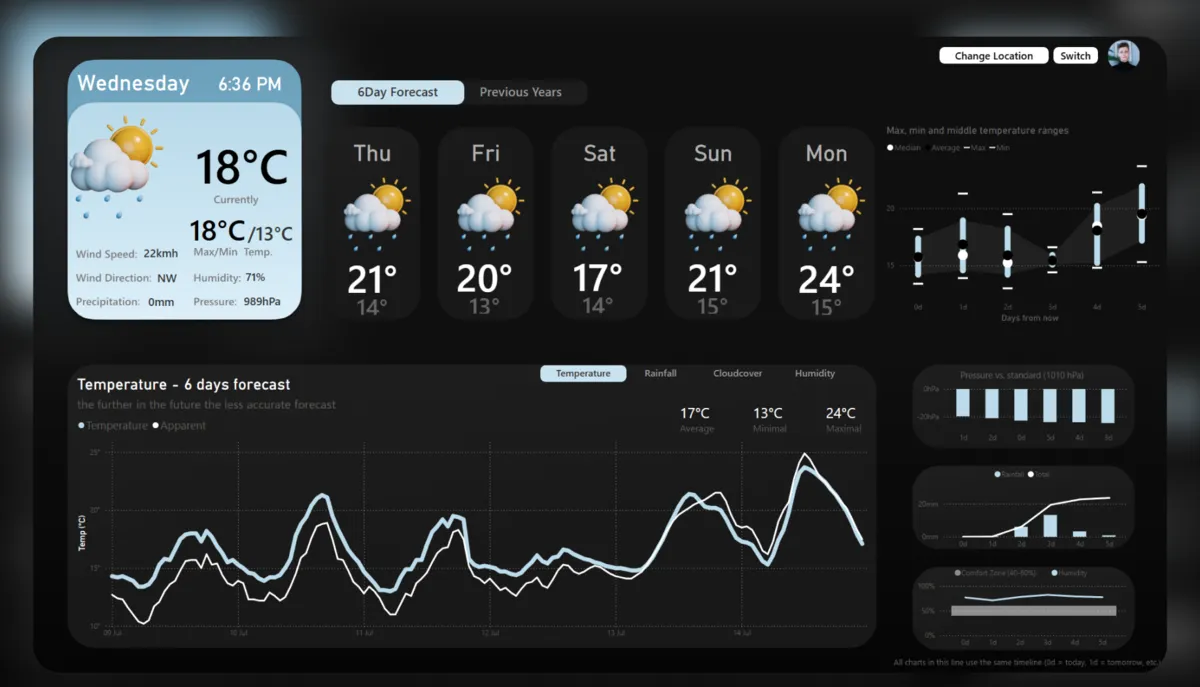
Welcome to my RPubs account, your gateway to a curated collection of my reports and interactive documents. Explore insights on demography, electrification, football teams, weather, and more. Delve into a world of knowledge and discovery—all from a single platform!

Airlines

Passanger's satisfaction dashboard. By selecting different dimensions, users can compare various passenger characteristics to assess their satisfaction with flights and explore the impact of individual factors. The algorithm also identifies similar passengers to one defined by user so that you can verify likelihood of such a passanger.